Transportation Comparative Benchmarking Platform
The National Cooperative Highway Research Program (NCHRP)
Developed in support of NCHRP project 20-118 by High Street Consulting Group (2017)
Five-year rolling average total number of persons suffering fatal injuries in a motor vehicle crash during a calendar year (All Public Roads)
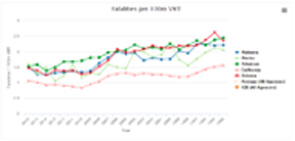
Five-year rolling average ratio of the total number of annual fatalities to the number of annual VMT (expressed in 100 million VMT) (All Public Roads)
Five-year rolling average total number of persons suffering at least one serious injury in a motor vehicle crash during a calendar year.
Five-year rolling average total number of fatalities and serious injuries of pedestrians, bicyclists, and other vulnerable road users.
Five-year rolling average of the ratio of the total number of serious injuries to the number of VMT (expressed in 100 million VMT).
Statewide percentage of pavements of the Interstate System in Good condition
Statewide percentage of pavements of the Interstate System in Poor condition
Statewide percentage of pavements of the Non-Interstate NHS in Good condition. (Full distress measure. Previously, FHWA allowed some states to report based on IRI only. IRI-only values are not displayed on this platform.)
Statewide percentage of pavements of the Non-Interstate NHS in Poor condition. (Full distress measure. Previously, FHWA allowed some states to report based on IRI only. IRI-only values are not displayed on this platform.)
Statewide percentage of deck area of bridges on the NHS classified as in Good condition
Statewide percentage of deck area of bridges on the NHS classified as in Poor condition
Calendar year ratio of the total number of serious injuries to the number of VMT (expressed in 100 million VMT).
Calendar year total number of fatalities and serious injuries of pedestrians, bicyclists, and other vulnerable road users.
Calendar year total number of persons suffering at least one serious injury in a motor vehicle crash during a calendar year.
Calendar year ratio of the total number of annual fatalities to the number of annual VMT (expressed in 100 million VMT) (All Public Roads)
Calendar year total number of persons suffering fatal injuries in a motor vehicle crash during a calendar year (All Public Roads)